Individual Ratings for Racing
Sailboat racing, like a lot of sports, has seen a slow decline in participation over the last several decades. Various organizations have commissioned studies and devised stop-gap measures to ease the cost and time commitment of participation, but nobody is talking about the elephant in the room- the steep hill to success. Climbing that hill takes commitment for an indefinite period of time while consuming an unknown amount of resources, with little to no feedback on progress made. Let’s face it, finishing last in every race for a year or more is discouraging to participation. A way to mitigate that defeat factor could be implementing an individual rating system for competitors, not unlike what is used in golf or bowling. While no rating system is perfect, gathering performance statistics and applying a formula, if it is simple enough, could form the basis for the systematic comparison of sailors at various skill levels. The following discussion offers one such possibility, but to be clear, it is not yet ready for use as a scoring system.

Over the last three sailing seasons, I collected elapsed time data at my home sailing club with the purpose of creating a method for comparing individual competitors. With the limitations that the proposed system works best if the competitor is sailing the same boat with minimum variations in setup, and the race management team pays reasonable attention to recording accurate individual elapsed times in each race, it is possible to derive a pattern of race performance and then convert that into an aspirational rating. With a rating in hand, comparing performance between competitors becomes fairly simple.
During the first season, I recorded the individual elapsed times of a dozen sailors racing in the weekly Tuesday night Laser series. A typical evening included five or six races around fifteen minutes in duration. By the end of the year, I accumulated data for over a hundred races. Looking at the raw elapsed times, it was easy to spot trends. The fleet broke out into three groups. The slowest group, middle group and the fastest group, with some mingling between them. Most of the races were won by one of the four sailors in the fastest group. Of those four, two of them won more often than the others. Of those two frequent winners, one was winning slightly more often. That was all well and good, but didn’t provide an answer to the question of “by how much?”
To compare the racers, I had to make an underlying assumption. For each race, the fastest sailor is assumed to have made the fewest mistakes and sailed as close to a minimum time race as was possible under the prevailing conditions. With that assumption, it is possible to use that sailor’s minimum elapsed time as a benchmark. In mathematical terms, it is the devisor in the conversion of a subsequent elapsed time to a percentage.
By converting minutes and seconds (60:60) into Decimals Minutes (60.00), the time of the second place and subsequent place boats can be compared to the minimum elapsed time. (To convert seconds, divide the seconds by 60 to get a decimal.)
Once the elapsed times are converted to decimal minutes, divide each elapsed time by the minimum elapsed time to get a relative elapsed time, rounded here to the third decimal place. For example:

From this example, it is easy to see the relationship more preciscly that just a numerical ranking such as 1, 2, 3 and 4. Second place took 2.4% longer to sail the course than the first boat, third place took 3.0% longer, and fourth place took 5.7% longer to sail the course.
Over the course of five races relative elapsed times might look like this:

Looking a this group of relative elapsed times, it is possible to make some more observations about the results.
Boat A won two races and had consistent elapsed times, until the last race.
Boat B won two races and was also consistent, except for race 4.
Boat C won one race, was consistent, and didn’t have a bad race.
Boat D didn’t win any races and had inconsistent elasped times.
Under the Racing Rules of Sailing, the low point scores look like this:

Combine the relative elapsed times, average them, and the outcome looks like this:

Boat B won under the RRS method, but Boat C moved up over Boat A and B in the cumulative relative elapsed time method because it spent less time sailing the same five races. There are many plausible explanations for this outcome. The most common is the leader not sailing the fastest course in order to cover the competition. This prevents the leader from getting passed at the last moment, but it also tends to compress the top of the fleet at the finish. It is noteworthy that a competitor can spend less total time on the track than another competitor and still have a lower ranking.
Averaging the combined relative elapsed times changes the order again. Why is that? Boat A’s worst race was significantly worse than Boat B’s. This artifact of averaging scores is significant in sailing. When a boat finishes last, the interval between “back of the fleet” boats is often very large. Generally because the skipper is is no longer actively racing or has suffered a breakdown and is completing the course just to avoid the scoring penalty for not finishing.
The observation that the first and last place boats often have irregular time intervals led me to conclude that averaging a sailor’s relative elapsed times produces a skewed number that is not representative of the sailors actual performance. The statistical solution for eliminating these wide swings is the median score.
The same series can produce another ranking based on the median relative elapsed time.

The median relative elapsed time gives a more reasonable snapshot of the sailor’s performance over the long run because it eliminates the outliers of the best and especially the worst scores. Here is a sample of actual relative elapsed time distributions for six sailor.

The red arrow denotes the median relative elapsed time.
Notice the huge intervals for back of the fleet finishes and the range of finishes for the inconsistent sailor.
While examining the data I gathered in the first season, I found that after about eleven races, I had a median relative elapsed time that reasonably reflected an individual’s performance in short track Laser racing. I used it to make finish order predictions of the subsequent races with a fair likelihood of success, correctly ordering about six out of ten boats. While watching the races where I’d made a prediction, or by post-race interviews, I was able to note where exceptional events occurred and correlate them with a sailor’s deviation from my prediction. Like so many things in life, it is the competitor with the fewest mistakes that wins. The other observation was that when a sailor moved up in the fleet it was not because they sailed faster, but rather because somebody else went down.
For the second season of data collection, I turned my attention to multi-class weekend racing. At my home club, there are typically two or three races on a weekend race day. Up to seven classes of one-design boats race the same course. After I collected eleven races worth of data for the more active competitors, I began crunching the numbers to see if any of it made sense. My first conclusion was yes. A trend was developing for each competitor. I attempted to make rank predictions, but soon found that the longer courses, sailed under more varied conditions, returned unsatisfactory results. I decided I needed a bigger sample size for each sailor. Unfortunately, there weren’t enough races left in the season to get significantly more races, so I decided to roll my data collection into the next season.
The next season produced the sample sizes I needed. By mid-season I had 40 or more races for the active racers, and at least 21 for the less active group. Using 21 as my minimum sample size, I began making predictions based on a competitor’s last 21 races. Because I had several classed to account for, I built rankings based on minimum elapsed time of the fastest boat compared to All boats and the fastest boat in each individual Class. A typical spreadsheet entry looks like this:

A simple spreadsheet such as this relays a boatload of information. J Cruz and JJ Jones sail a lot. Based on their Lifetime Class median relative elapsed time, they win quite a few class races. The last 21 races indicates they are finishing better than previously. R Black sails a fair amount, but he’s getting slightly slower. A Smith just reached 21 races, so there isn’t any trend information, but it is possible to make a prediction about how a race involving these four sailors might turn out.
In a predicted class race, the two Thistles will probably finish very close together with J Cruz taking the win. Of the Day Sailers, JJ Jones is the easy pick to win with A Smith a few minutes behind.
An individual rating? Derived from all this historical data? I think we can do that.
Looking back at the competitors in the previous example, it is easy to imagine a correction factor based on the last 21 races. For example, Cruz is 1.1% off the mark, and Black is 3.1% off the mark. If they each had a personal rating that subtracted that percent off their relative elapsed time, they would be dead even. Sounds great! Except we don’t really want them to be mathematically dead even. That’s where the aspirational factor comes in. If everybody sails a good race nobody would win, so the solution is removing a tiny piece of that correction. Instead of correcting by the whole amount, take 97% of it.

Now for a theoretical match-up between our sailors, corrected using the Last 21 All :
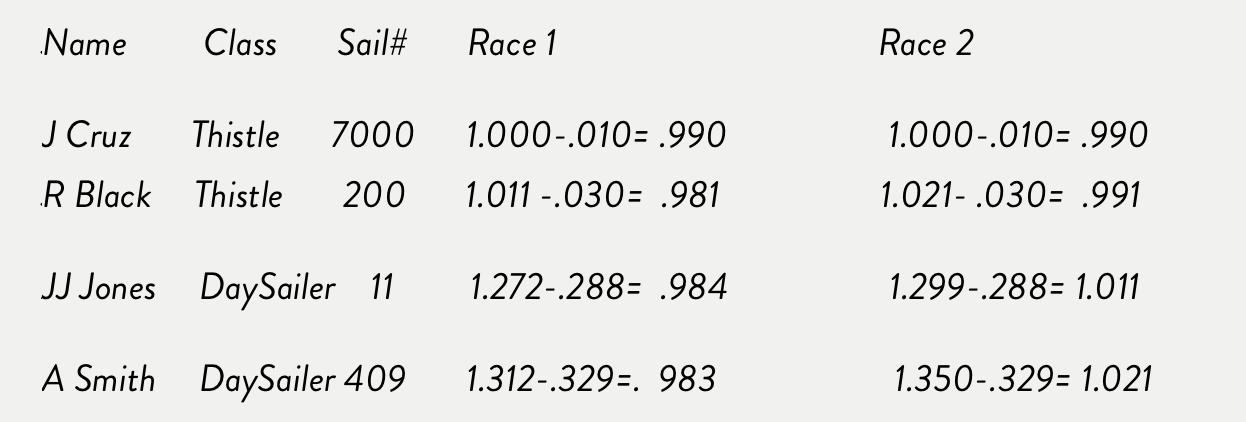
In the first race scenario, all of the competitors sailed faster than their median relative elapsed time and corrected very close to each other. In the second race, the Day Sailers missed their median relative elapsed time. The easy indication of this is a number less than or greater than 1.000.
Given the class specific data, the same corrections can be computed within each class. It is also possible to slow the rate of change in the correction factor by using the bigger Lifetime sample size. This would be a discussion point within a club or class to account for variation in equipment. For example, if J Cruz added new sails and R Black didn’t, the Last 21 median relative elapsed time will reflect that change sooner than the Lifetime median relative elapsed time. Conversely, the Lifetime median relative elapsed time is more resistant to tampering because it is very slow to change. I am also tinkering with a method of converting median relative elapsed time to a Portsmouth rating.
It is my intention to continue tracking elapsed time for the rest of the season, and present my findings to any sailor who will listen. If you think this system has merit, flaws, or potential for improvement, I’d love to hear about it. Drop me a line at timothymsavageinfo@gmail.com.